Parents, concerns swirl so easily when faced with the unknown—especially when it comes to how your baby is growing inside. Maybe you have stared at those ultrasound reports and wondered, “Is everything on track? Is my baby too small, or too big?” The numbers, the graphs, the medical jargon—all can feel overwhelming. Yet, understanding a baby weight chart during pregnancy does not have to be a mystery reserved for specialists. Here is a practical, science-backed tour through what those numbers mean, how to interpret the growth milestones, what influences those figures, and how you can use the information to feel reassured and supported, week by week.
What is a baby weight chart during pregnancy and why is it important?
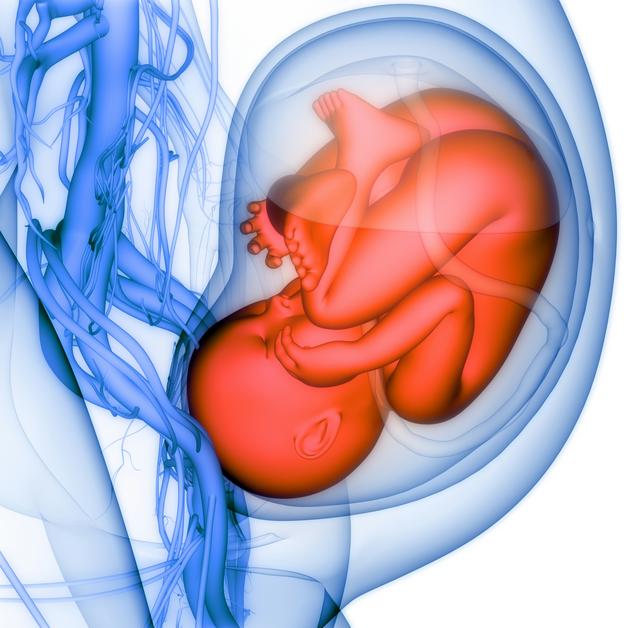
A baby weight chart during pregnancy acts like a roadmap, tracing the path of your baby’s growth from the first flutterings of life to the day of birth. But it is not merely a set of numbers—think of it as a living story, where each scan and estimation adds a new chapter. Typically, these charts show gestational age (in weeks) on the horizontal axis and estimated fetal weight (in grams or kilograms) on the vertical axis. Reference points, like the 10th, 50th, and 90th percentiles, allow doctors to see where your baby fits alongside thousands of others—yet your little one’s journey is utterly unique.
Would you believe the same measurements—like abdominal circumference (AC), head circumference (HC), femur length (FL), and biparietal diameter (BPD)—plugged into different formulas (Hadlock, INTERGROWTH‑21st, WHO, or customized Indian charts) could shift your baby up or down a percentile line? That is why asking your doctor which chart they are using, and why, is so valuable. One number on its own rarely tells the full story; patterns and trends matter far more.
How is fetal weight actually estimated?
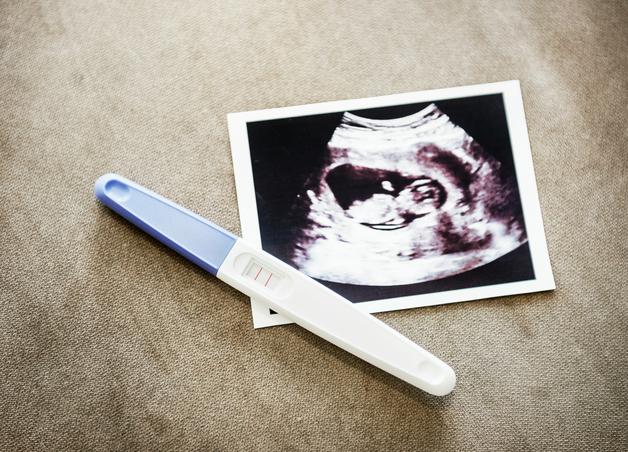
Here’s a quick dive into the practical magic—ultrasound. Health professionals use key biometric measurements (such as AC, HC, FL, and BPD) taken during your routine scans. These numbers feed into specialized formulas known as Estimated Fetal Weight (EFW) equations, with the Hadlock formula often leading the way. For instance, the INTERGROWTH‑21st and FMF approaches exist, but the underlying process is similar: they turn careful measurements into an estimated weight. Yet, all ultrasound weight estimates carry a margin of error—about ±10–15%. Think of it as getting a weather forecast: it gives a useful guide, not a precise prediction. Why such variability? Factors like the sonographer’s technique, baby’s position, amniotic fluid levels, maternal body structure and even which machine is used contribute to the variety you might encounter scan to scan.

Did you know, in the first trimester, crown–rump length (CRL) is the star metric for dating the pregnancy as it is most accurate at this early stage? As time progresses, the accuracy margin increases. This is precisely why regular, serial scans—rather than fixing on a one-off measurement—provide more reliable insight into how your baby’s growth is unfolding.
Understanding percentiles, growth velocities, and what “normal” really means
Now, you may hear the words: 10th percentile, 50th percentile, 90th percentile—what exactly do these mean in a baby weight chart during pregnancy? For each gestational week, the 50th percentile represents the typical weight for that stage. Below the 10th, clinicians might consider the baby as small for gestational age (SGA); above the 90th, large for gestational age (LGA) captures the bigger babies.
But let’s not leap to conclusions on a single value! It’s the ongoing trend—the direction your baby’s weight takes from scan to scan—that grabs your clinical team’s attention. Repeated downward crossings of percentile lines prompt further checks, while short-lived dips or jumps are often resolved at the next visit.
Z-scores and growth velocity explained
Beyond percentiles, some maternity teams prefer z-scores—these show how many standard deviations a baby’s weight is from the mean. Why? Because even small shifts become visible, helping to detect early deviations that merit intervention or extra monitoring. For most families, though, percentiles offer a clear, friendly way to visualise growth.
Week-by-week baby weight chart during pregnancy: What does the data say?
Numbers tell their own story, and you might be surprised at the range. Here’s an illustrative glance at typical estimated fetal weights for singletons, echoing recognized references (Hadlock et al., and commonly used parent guides):
- 12 weeks: about 14–20 grams
- 16 weeks: around 100–120 grams
- 20 weeks: about 280–300 grams
- 24 weeks: 600–700 grams
- 28 weeks: 1,000–1,200 grams
- 32 weeks: 1,800–2,000 grams
- 36 weeks: 2,500–2,900 grams
- 40 weeks: 3,000–3,600 grams or sometimes higher
Let us pause—do these ranges seem wide? That’s because individual trajectories diverge, and baby weight chart during pregnancy figures are always population-based. The average serves as an anchor, but genetics, maternal nutrition, and health conditions introduce significant variations.
What influences my baby’s weight? Decoding the hidden factors
So many elements come into play. Maternal height, pre-pregnancy weight, parity (number of previous pregnancies), genetic factors, maternal age—all shape the upper and lower boundaries of the chart. Pre-existing health conditions such as gestational diabetes often tilt the scale toward higher weights; hypertension, hypothyroidism, and issues like placental insufficiency can lead to restricted growth.
Curiously, lifestyle influences, while real, typically have less impact than genetics or placental function, unless nutritional imbalance is significant. Even “eating for two” does not guarantee a larger baby—balanced diet, hydration, and appropriate supplementation (iron, folate, iodine, vitamin D, and omega‑3) serve your child best.
Twins and other multiples? Their own set of charts exists, as the growth expectations—and clinical approaches—differ meaningfully from single pregnancies.
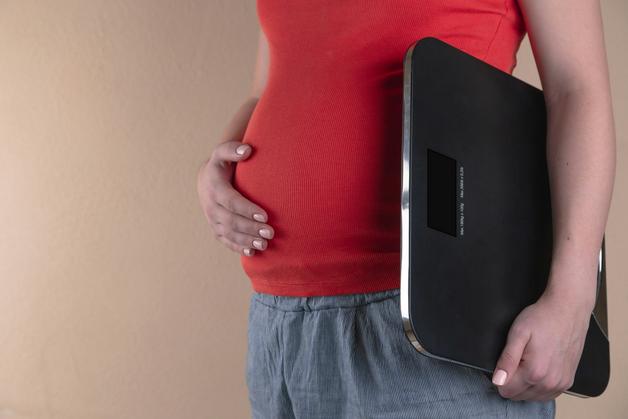
Maternal weight gain: A cause, a consequence, or a clue?
The balance of maternal weight gain echoes in baby weight chart during pregnancy results, but the maths are not straightforward. Healthy gains are recommended based on pre-pregnancy BMI, with the range for single versus multiple pregnancies differing. One might imagine rapid weight gain equals a bigger baby, but this is not always true. Steady, appropriate increases, supported by regular meals, moderate physical activity, and good sleep, support optimal foetal growth. Yet, both excessive and insufficient gain should be reviewed—it is about ensuring the best possible environment for baby.
When the chart raises concern: Steps to take for small or large babies
If your care provider tells you your baby is measuring “small” (SGA) or “large” (LGA), what comes next? The first action is usually to confirm pregnancy dating—sometimes, it’s just a matter of timing. Serial monitoring follows, sometimes with Doppler studies to assess blood flow, and expanded testing for maternal conditions.
A persistently small EFW (Estimated Fetal Weight) may trigger additional ultrasound scans, checks for placental health, and monitoring of amniotic fluid, with frequent follow-ups to keep a close watch. If a baby measures “large,” clinicians re-examine glucose levels, review dates, and discuss delivery planning in case size influences risks such as shoulder dystocia.
Above all, stay curious—ask questions, attend all follow-ups, and seek clarification on what the data means for you. Trends count more than snapshots.
Special cases: Multiples, preterm, and post-term babies
Twins and higher-order multiples break many of the single-baby rules. Twin-specific baby weight chart during pregnancy tools better reflect their growth; monochorionic twins (those sharing a placenta) need especially close surveillance for complications like twin-to-twin transfusion syndrome.
Early babies? Preterm management focuses more on growth velocity and overall health than on where the numbers fall in a percentile range. After the due date, placental aging becomes a concern, and changing amniotic fluid levels may influence clinical recommendations on timing of delivery.
What happens at scans and between appointments?
Growth scans usually involve a colourful flurry of measurements—HC, AC, FL, BPD—plus assessments of amniotic fluid and placenta. These appointments typically last 20–40 minutes. Fundal height (measuring from pubic bone to the top of the uterus) becomes another tool from around 20 weeks onwards. At home, awareness of foetal movement (ten kicks in two hours, during active periods, for instance) serves as an important day-to-day indicator of wellbeing.
Unexpected decrease in baby’s movement, bleeding, leaking fluid, or severe pain? Contact your care team quickly—responsive action leads to better outcomes.
Myths, misconceptions, and reassuring facts for parents
The medical data can confuse; let’s sort myth from reality:
- Ultrasound weight is never exact, always within an error margin.
- A single low/high reading very rarely equates to immediate concern. Trends are decisive.
- Online calculators aren’t substitutes for professional ultrasound and personalised advice.
- No, a bigger “baby bump” does not automatically mean a bigger baby; maternal shape and amniotic fluid play a huge role.
Key Takeaways
- The baby weight chart during pregnancy provides a population-based reference, guiding clinicians and reassuring parents—but it does not predict an individual baby’s exact weight.
- Biometric ultrasound measurements, interpreted via established formulas, give an estimate with known margins of error. Serial trends over time matter far more than isolated numbers.
- Growth percentiles and z-scores assist in identifying those babies who would benefit from closer monitoring or intervention, but each trajectory is highly personal.
- Maternal health—nutrition, weight gain, pre-existing conditions—plays a real but not exclusive role in fetal growth. Genetics and placenta function are often decisive.
- Should the data prompt extra checks, know that multiple follow-up steps exist, and clarification with your health team is always wise.
- To empower your journey, download the Heloa app for tailored health advice and free child health questionnaires, designed to support you every step of the way.
Questions Parents Ask
How often are growth scans required, and at what weeks do they happen?
Scan schedules usually depend on health context and any previous findings. Commonly, an in-depth anatomy scan takes place around 18–22 weeks for structural review and precise dating. A routine growth check comes towards the end of the second or start of the third trimester—often between 28 and 32 weeks—when weight differences become easier to spot. If baby’s growth patterns shift higher or lower than expected, doctors tend to recommend repeat scans every two to four weeks. In cases needing extra observation (significant growth issues, abnormal blood flow, or special risks), checks may be weekly or include extra monitoring such as nonstress tests or biophysical profiles. Simple checks like fundal height measurement and tracking fetal movement bridge the gaps between scans, while any unusual symptoms (reduced movement, bleeding) mean an earlier visit is best.
What questions should I ask my care provider about the baby weight chart during pregnancy and the results?
Bringing a checklist can make conversations smoother. Useful questions include:
- Which chart or EFW formula are you using (Hadlock, INTERGROWTH, WHO, etc.)?
- How accurate is today’s estimated fetal weight? What is the range or error margin?
- What percentile and z-score does this scan show? How has the weight changed across previous visits?
- Are my pregnancy dates fully confirmed and consistent with my history?
- Which additional tests or timing would you recommend if this growth pattern continues?
- Are there maternal factors like height, previous weight, diabetes, or even smoking history influencing the reading?
- Will this result affect delivery planning? Are there symptoms which mean I should contact you earlier?
- Can I have a copy of the chart or report, with a simple breakdown of each term?
My baby’s actual birth weight was different from the final scan estimate. Should I be concerned?
It’s more common than you might expect for birth weight to vary from the last ultrasound prediction. Differences of up to 10–15% (sometimes even more, in certain cases) are routine because fetal position, time lag between scan and delivery, as well as specific calculation methods, all have their influence. Most discrepancies are harmless. If the difference is significant, care teams may review scan details and consider if additional infant checks or follow-up is required. For peace of mind, a conversation with the care provider or newborn specialist can clear up doubts and indicate any steps needed for your baby.

Further reading :